On-screen graphic shows NASA logo.
On-screen animation shows a hand drawing a graph before it is covered by large stamp reading 'Rejected'.
On-screen text reads 'Graphing'.
On-screen animation shows two cars speeding off a rollercoaster.
NARRATOR:
Graphs are used every day to see relationships…
(Crash!)
NARRATOR:
..everything from ticket sales to insurance claims.
On-screen animation shows various graphs.
On-screen animation shows a clock and a thermometer.
On-screen text reads 'Time vs temperature'.
NARRATOR:
If you want to see how one thing relates to another, you can probably use a graph.
Shot of a line graph printed on paper.
NARRATOR:
And, believe it or not, NASA has graphs for just about everything.
On-screen animation shows NASA logo surrounded by various graphs.
NARRATOR:
So what's the big secret?
On-screen animation shows a ring of question marks.
NARRATOR:
Let's start from the beginning.
On-screen animation shows the graph drawn at start of program.
NARRATOR:
No, no, no, let's start from the right beginning — the x-axis.
On-screen text reads 'The X-Axis'.
NARRATOR:
The x-axis needs to be a horizontal line at the bottom of your graph.
On-screen animation shows a hand drawing a horizontal line.
NARRATOR:
Yes, that's right. Now we will draw our y-axis.
On-screen text reads 'The Y-Axis'.
NARRATOR:
This one's vertical.
On-screen animation shows a hand drawing a vertical line from the middle of the x-axis.
NARRATOR:
No, no, no, your y-axis needs to be on the left edge of your x-axis.
On-screen animation shows hand pushing the y-axis line to left edge of x-axis.
NARRATOR:
Now we're on to something! Hmm, we need an example.
On-screen animation shows Earth with an arrow to a small red planet.
NARRATOR:
Well, let's say we want to travel to other planets. We obviously need food to get there and back.
Shot of a food tin with a hamburger on the label.
NARRATOR:
So we want to see the relationship between the planet we're going to and how much food each person will need to take with them.
On-screen animation shows the small red planet linked by an equals sign to tins of food.
NARRATOR:
So, first, label your axes.
On-screen animation shows hand labelling the horizontal line 'X' and the vertical line 'Y'.
NARRATOR:
As a rule, we always put our independent variable on the x-axis.
On-screen animation shows hand labelling x-axis 'Number of days' with increments of five.
NARRATOR:
In this case, we'll put the number of days it takes to get to any given planet. On the y-axis, we'll put the dependent variable.
On-screen animation shows hand labelling y-axis 'Food (kg)' with increments of ten.
NARRATOR:
Why is it called the dependent variable?
On-screen animation shows spaceship leaving Earth, with increasing tins of food as it travels further away.
On-screen text reads 'Day 1' sequentially through to 'Day 9'. Well, in our example, the amount of food we need in kilograms depends upon how long it takes to get there and back.
Shot of the Earth from space.
NARRATOR:
So let's think of some examples. Ah, the International Space Station.
On-screen animation shows a postcard that reads 'Greetings from the International Space Station'.
NARRATOR:
That's about a seven-day mission.
Shot of space shuttle approaching the space station.
On-screen text reads '1.83kg x 7 days'.
NARRATOR:
Since we need about 1.83kg of food per day, that's… let's see… 12.81kg.
On-screen animation shows 12.81kg mapped on the graph.
NARRATOR:
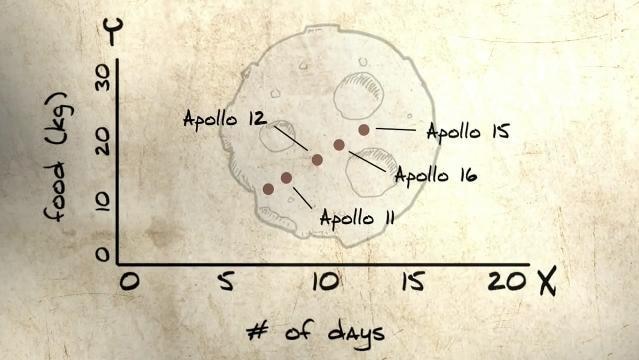
Now let's go to the moon. We'll put in a few of the Apollo missions for reference.
On-screen animation shows multiple dots mapped on the graph.
On-screen text reads 'Apollo 12, Apollo 15, Apollo 16, Apollo 11'.
NARRATOR:
Now we have a bunch of dots. It sort of makes sense, but let's connect them all with a line.
On-screen animation shows a hand drawing a straight line from zero through the dots on the graph.
NARRATOR:
Ah, now that looks better.
Various shots of men eating in zero gravity.
NARRATOR:
We can now see the relationship between how long a mission is and how much food we need to take. This lets us ask some good questions, like, how much food would it take to get to, say, Mars?
On-screen animation shows food consumed over time graph with a marker at 1,830kg.
On-screen text reads '1,000 days, 1,830kg'.
NARRATOR:
Wow, that's a lot of food for one person.
Various shots of engineers working in labs.
NARRATOR:
Fortunately, NASA engineers think about these questions every day.
Shot of night sky with stars.
NARRATOR:
Well, there you go, folks. Next time you want to see how two things relate to one another, that's right — draw a graph.
On-screen animation shows the food consumed over time graph.
On-screen animation shows cogs making a logo.
On-screen text reads 'BEST — beginning engineering, science, and technology.'
(Children cheer)